Koha Tutorial Videos
Monday Minutes: Chart Feature in Report
 by Jessie Zairo on Aug 7, 2023
In this week's Monday Minutes, Kelly and Jessie show you how to create charts in the reports module.
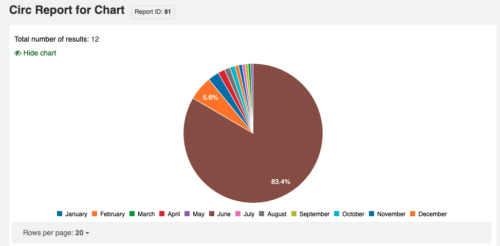
Create a Chart in Reports
- Navigate to Reports --> Saved reports
- Search or select the report you would like to create a chart for
- Under actions click run
- if applicable enter the parameters and click run the report
- Notice there is a Create Chart Link, click
- This will provide settings to select the type of chart and columns for visible rows
- You can create Pie Bar of Line Charts
- You can select the desired X column
- You can select the checkbox to exclude the last line
- Click Draw
Example Reports
SELECT
monthname(datetime) AS month,
SUM( IF(type = 'issue', 1, 0 )) AS Issues,
SUM( IF(type = 'renew', 1, 0 )) AS Renewals,
SUM( IF(type = 'return', 1, 0 )) AS Returns,
COUNT(statistics.type) AS 'Total Transactions'
FROM statistics
WHERE YEAR(datetime) = <<Enter Year YYYY>>
GROUP BY month
ORDER BY month(datetime) ASC
Additional Resources
Self Paced Learning in Koha: Reports
Read more by Jessie Zairo